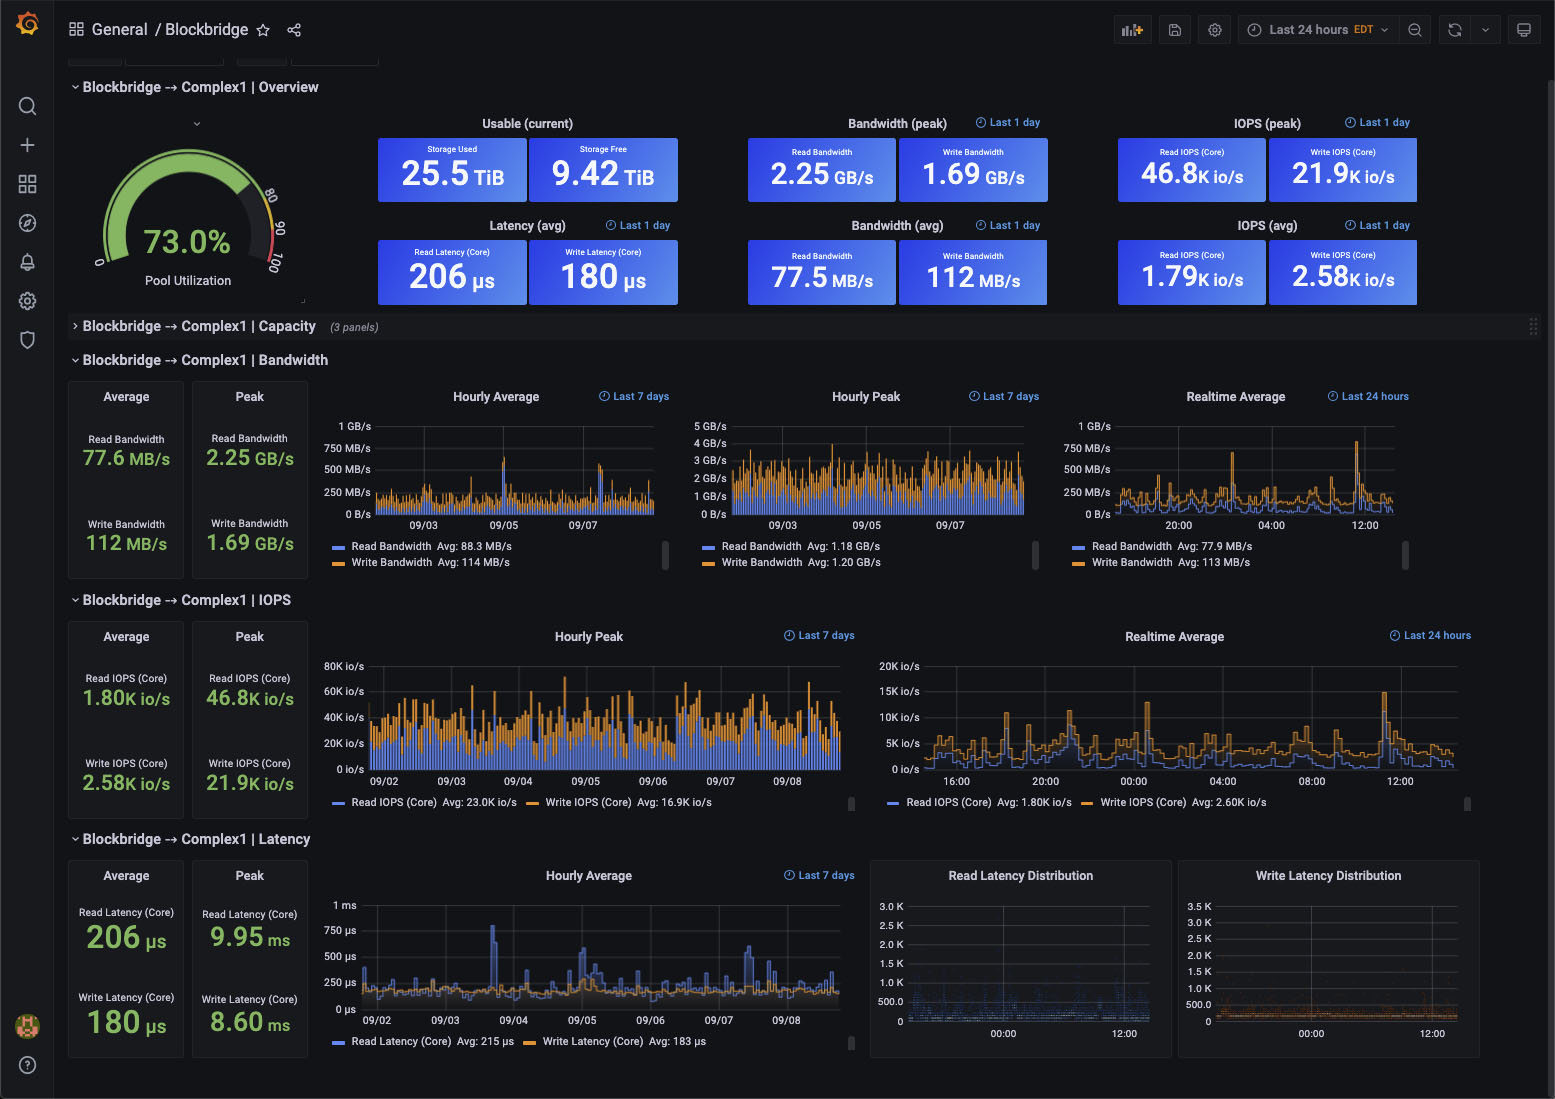
This guide covers using Grafana to visualize realtime and historical Blockbridge statistics. After configuring Grafana and your datasource, the easiest way to get started is to use the official Blockbridge dashboard.
Planning and Deployment
Supported Versions
- Blockbridge: 5.1.3+
- Grafana: 7.5.0+
- simpod-json-datasource: 0.2.6
Install the JSON Datasource Plugin
Blockbridge integrates with Grafana using the JSON API Grafana
Datasource.
Install the datasource plugin on your Grafana server using the grafana-cli command:
$ grafana-cli plugins install simpod-json-datasource 0.2.6
Iinstalling simpod-json-datasource @ 0.2.6
from: https://grafana.com/api/plugins/simpod-json-datasource/versions/0.2.6/download
into: /usr/local/var/lib/grafana/plugins

✔ Installed simpod-json-datasource successfully
After installing the datasource, restart the grafana-server service. For CentOS 7, use systemctl:
$ sudo systemctl start grafana-server
If you’re running Grafana in macOS with Homebrew, restart the brew service:
brew services restart grafana
If you need help with other operating systems, contact support@blockbridge.com.
Configure A Grafana Datasource
Create A Datasource
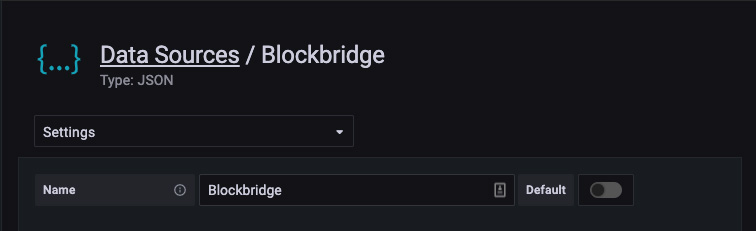
Create a datasource for each Blockbridge backend you’d like to monitor.
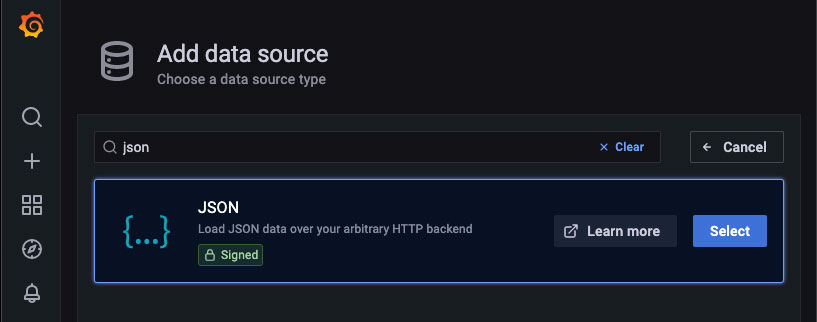
- Go to the Grafana “Data Sources” configuration section.
- Click Add data source.
- Enter “JSON” into the search box
- Select the “JSON” datasource plugin
Datasource Naming
Our sample dashboards expect that datasource names contain Block. If this is inconvenient, you must update the Instance name filter of the datasource variable in the dashboard. This is found in Dashboard Settings -> Variables
Blockbridge API Endpoint
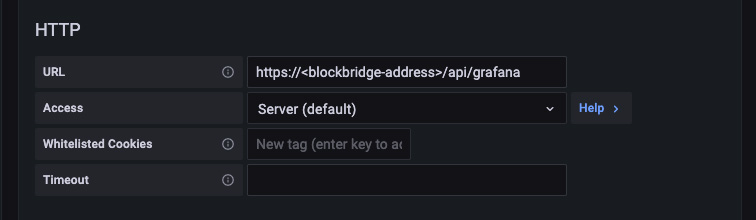
Configure the data source using the Blockbridge API details:
-
URL: Enter the HTTPS URL for your Blockbridge management host, appending “/api/grafana”. If your management node is a cluster, be sure to use a VIP for API access. For example, if your management host is
blockbridge.example, specifyhttps://blockbridge.example/api/grafana/for the datasource URL. -
Access: Only Server access is supported.
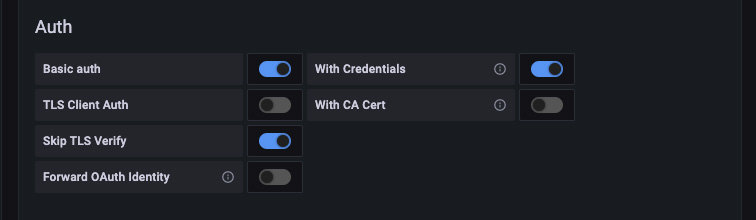
Blockbridge API Authentication
Configure basic HTTP authentication.
- Basic Auth: This must be enabled.
- With Credentials: This must be enabled.
- Skip TLS Verify: Enable this if your management host’s HTTPS certificate is self-signed.
- Leave the remaining Auth options disabled.
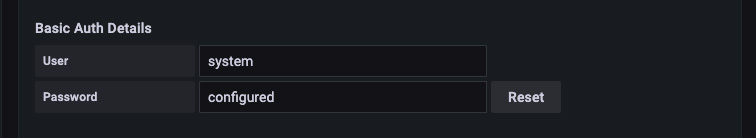
- User: Set this to a user with statistics query permissions. The simplest
option is to use the existing
systemuser. - Password: You may use either a persistent authorization access token or a password.
Save and Test
Once you’ve entered the datasource configuration, click Save & Test. You should see a Data source is working message displayed; If you don’t, confirm your blockbridge management node is accessible from Grafana and try again. If you’re still having trouble, contact support@blockbridge.com.

Import the Blockbridge Dashboard
Download the Blockbridge Grafana Dashboard. You can save it locally or copy its contents to your clipboard.
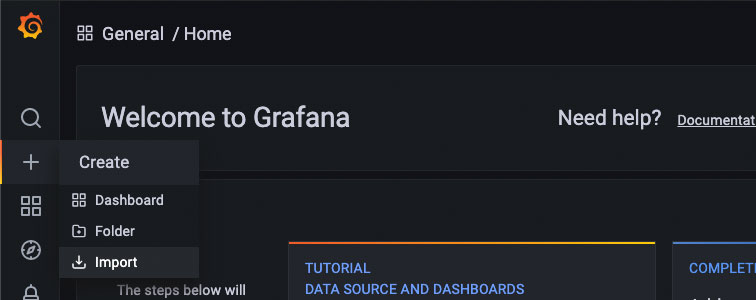
Import the dashboard by uploading the dashboard JSON file or pasting the contents into the “Import via panel json” box.
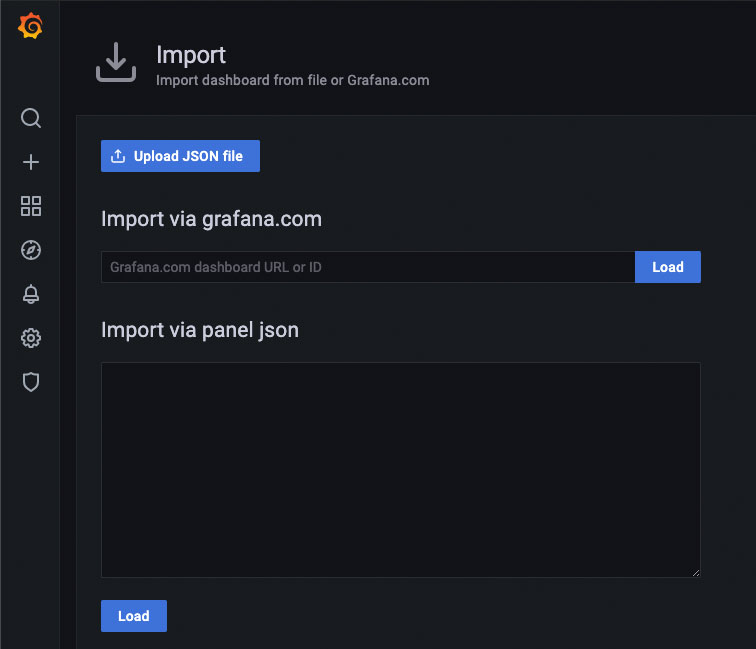
Click load to complete the import progess and view the dashboard.
Advanced Configuration
Query Parameters
There are a variety of parameters available to adjust query execution. Parameters may be supplied in two ways:
- as variables associated with the dashboard.
- as data associated with a particular panel’s query specification.
Parameters specified in a query body take precedence over dashboard-level variables. A reasonable default is selected by the backend query processor if neither are specified.
| parameter | default value | valid values | description |
|---|---|---|---|
| dataset | historical | historical, realtime | Specify the set of series to return for a given metric. By default, long-term historical data is returned. To select the high-frequency realtime data series, specify realtime. This is effectively a series name prefix selector; for more control over what series to return, use the series_filter parameter. |
| series_filter | none | string or array of strings | Interpreted as a regular expression, this parameter filters the set of series which are returned. An array of strings turns into a regexp union (i.e., an or match.) |
| func | series dependent | min, max, avg | Specify the function used for calculating a value over a given range. For historical datasets, each stx block includes a [min, max, average] tuple, as a gauge. Each series has a default func value appropriate for most purposes. For realtime data, the only supported func value is avg. |
| consolidate_by | func | min, max, avg, disabled | Specify the point consolidation function used when the number of available data points exceeds a query’s max data points. By default, point consolidation is performed using the currently selected func value. The special value disabled may be used to completely disable point consolidation. |
| legend_format | automatic | templated string | By default, the query processor selects a legend that makes sense for the series data. (In reality, the default is currently always “%{title}”, but that may change in the future.) For a list of variables available in format string interpolation, see the Format String Variables section. |
Format String Variables
| variable | example | description |
|---|---|---|
| title | Read IOPS (Metered) | Series title formatted for human consumption. This may change from one software release to the next. |
| name | realtime_metered_read_iops | Series name. This is the series identifier used in selection filters, and won’t change from one software release to the next. |
| unit | iops | Series unit of measure. |
| block | sys_ds_history | Backend stats block name used to source series data. |
| func | avg | Series data function. (see the description in Query Parameters for more detail.) |
| eval_interval | 10m | Series data evaluation interval. This is automatically determined based on the source scrape interval, the series-specific evaluation interval (if any), and the query intervalMs parameter. |
In addition, any series configuration parameters and backend timeseries tags may be used.
Available tags as of Blockbridge 5.1.3 are: obj_id (serial number of the
object being inspected), obj_label (user-specificed object label, if any. If
the object has no label, the serial number is returned for this tag as well.)
Formatting a legend using additional series configuration values may or may not be useful – perhaps when specifying a custom metric via the query payload json.
Variable Queries
Grafana variables allow for easy switching between several different (or multiple) options. For Blockbridge Data Sources, several variable queries are defined. This allows a single generic dashboard to be used with multiple different backends.
Some queries return simple selections that may only change on backend software update. Others retrieve data based on the current backend configuration.
Object Labels
To query object labels, use the following syntax:
object_labels(<type>)
An object-label query retrieves the current set of labels and IDs for a
particular backend object type. Currently, the only supported object type is
sys_ds (a Datastore).
Use object_labels(sys_ds) to query for Datastore object labels.
Set the Query Refresh option to On Dashboard Load to pick up backend configuration changes.
Enable the Selection Multi-value option to allow selection of more than one Datastore. If multiple datastores are selected, their statistical data is displayed on the same chart. Enable the Selection “Include All option” to allow the dashboard user to easily select all datastores.
The backend query processor automatically consumes variables which have properly formatted Blockbridge serial numbers as values. When grafana support is expanded to other types of objects, this may need to be revisited. As currently implemented, every query will be executed for every submitted serial number, which could get out of hand pretty quickly.
Datasets
To query for dataset options, use the following syntax:
datasets
The default metrics define series grouped into two distinct datasets:
- historical – lower-resolution, but stored for longer.
- realtime – higher-resolution, stored for less time.
Metrics
Statistics data is divided up into a collection of Metrics. Each metric has one or more series defined. When a metric is queried, the metric’s set of series are returned. Each metric has a collection of historical and realtime series. By default, the historical series are returned.
There is one additional metric which is not exposed by default – Debug.
Entering the string “Debug” into the “Metric:” query will a set of internal
debug series. As of 5.1.3, there are two series: realtime_cfg_obj_chg and
realtime_rpc_recv. There is no corresponding historical data, so if you’re
not seeing anything, you’re probably missing a dataset parameter.
Developer Extensions
Custom Metrics
A completely custom metric specification may be supplied in the query Body using
the custom_metric key, which must be an array of series specifications.
Each series specification must be a json object with one or more keys:
| key | default | valid values | description |
|---|---|---|---|
| type | Timeseries | Timeseries, MeterTimeseries, PerSecSeries, StorageSeries, FreespaceSeries | This maps directly to a Timeseries class in the backend query processor. The biggest thing to note is that MeterTimeseries must be used when querying and processing sys_ds_meter data, as it accounts for the difference in stats block data format. Other classes may be used for counter based data, or if raw stats are being returned. |
| title | none | any string value | (required) Human-readable series title |
| name | none | any string value | (required) Internal series identifier string |
| block | none | stats block name | (required) Backend stats block name |
| field | none | string or object | (required) Stats var name or raw specification. Pre-existing vars may be specfied by name; to query ad-hoc stats vars (e.g., from the system block), specify the var spec using a json object. (see the Custom stats vars) section below for what keys are required.) More than one field may be specified, as an array of strings or raw specification objects. |
| scale | none | string, object or number | (optional) Scaling value. May be a field specification or a constant scaling factor. Specifying a scaling field is identical to the field specification, except an array is not permitted. |
| rate | none | string, object or number | (optional) Specification of the stat rate of change. This may be a constant scaling factor (number), a single field specification or an array of field specifications. |
| unit | none | grafana unit spec string | (required) Unit of measure to return with the timeseries data. |
| func | avg | min, max, avg | (optional) Raw data processing function. See the earlier discussion of func for more details. |
| consolidate_by | func value | min, max, avg, disabled | (optional) Point consolidation function. See the earlier discussion of consolidate_by for more details. |
| reduce_y | + | +, -, /, * | For series with more than one field value specified, this operator defines how the values are reduced. By default, the values are summed. Any ruby-provided binary arithmatic operator should work. |
| reduce_rate | + | +, -, /, * | For series with more than one rate value specified, this operator defines how the values are reduced. By default, the values are summed. As with reduce_y, any ruby-provided binary arithmatic operator is fair game. |
| max_period | none | integer milliseconds | If specified, puts an upper-bound on the backend stats query period. This can be used to ensure all points are returned for non-counter based stx blocks. |
| scrape_interval | timeseries-class-dependent | integer milliseconds | Specify the backend scrape interval. For the Timeseries class, this defaults to 10s. For MeterTimeseries it defaults to 1hr. This influences the derived value of eval_interval, and likely doesn’t need to be specified, unless you’re doing something particularly “high end”. |
| legend_format | ”%{title}” | format string | Specify the series legend format string. See the earlier Format String Variables section for more details. |
Custom Statistics Variables
Custom vars must specify the following pieces of information:
| key | value/type | description |
|---|---|---|
| oid_type | oid magic string | Object type this var applies to. e.g., sys_ds. |
| block | stx block name | Backend stx block name. e.g., sys_ds_history. |
| var | string | Name of variable in stat block data section. e.g., reserve_size. |
| counter | boolean | Is this value a counter? If yes, specify true. If it’s a gague (or you want to read/return raw counter values) specify false. |
| units | string | Variable unit of measure. [Currently unused, but must be specified] |
| desc | string | Human readable description of variable. |
Appendix
Persistent Authorizations For Grafana
We always recommend scoping permissions to an absolute minimum. A Grafana dashboard only requires the account-level view_statistics right. To permit viewing statistics on all configured node resources, set the node scope to all. Here’s how to generate a persistent authorization using the command line tools as the system user.
First, authenticate as the system user:
$ bb auth login
Authenticating to https://127.0.0.1/api

Enter user or access token: system
Password for system: *************
Authenticated; token expires in 3599 seconds.

== Authenticated as user system.
Once authenticated, create the authorization:
$ bb authorization create --notes "Grafana Dashboard" --scope "n:o=all a:r=view_statistics"
== Created authorization: ATH4762194C41F0484F

== Authorization: ATH4762194C41F0484F
notes                 Grafana Dashboard
serial                ATH4762194C41F0484F
account               system (ACT0762194C40626445)
user                  system (USR1B62194C40626440)
enabled               yes
created at            2021-09-09 13:36:05 -0400
access type           online
token suffix          YhIqH+gQ
restrict              auth
enforce 2-factor      false
scope                 n:o=all a:r=view_statistics

== Access Token
access token          1//8q0ICKh9MB******************/goY4GpPUcua+7v5iYhIqH+gQ

*** Remember to record your access token!
The displayed access token is used as the Basic Auth password in your data source configuration.
And, don’t forget to logout
$ bb auth logout